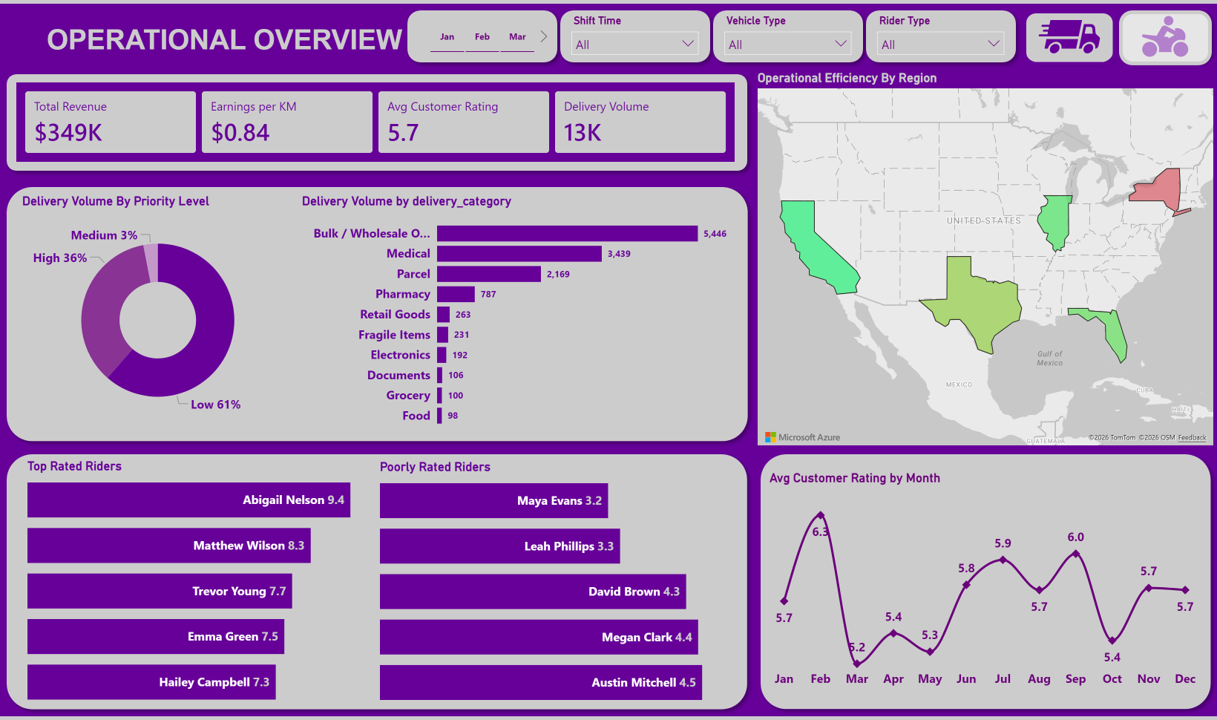
This project analyzes the rider, delivery, and operations data of a last-mile logistics and delivery platform, using Microsoft Excel and Power BI. It models and visualizes revenue, efficiency, and performance metrics across regions and riders.
The analysis also includes an interactive dashboard that helps to identify high performers, uncover inefficiencies, and make data‑driven decisions to improve service quality and profitability.
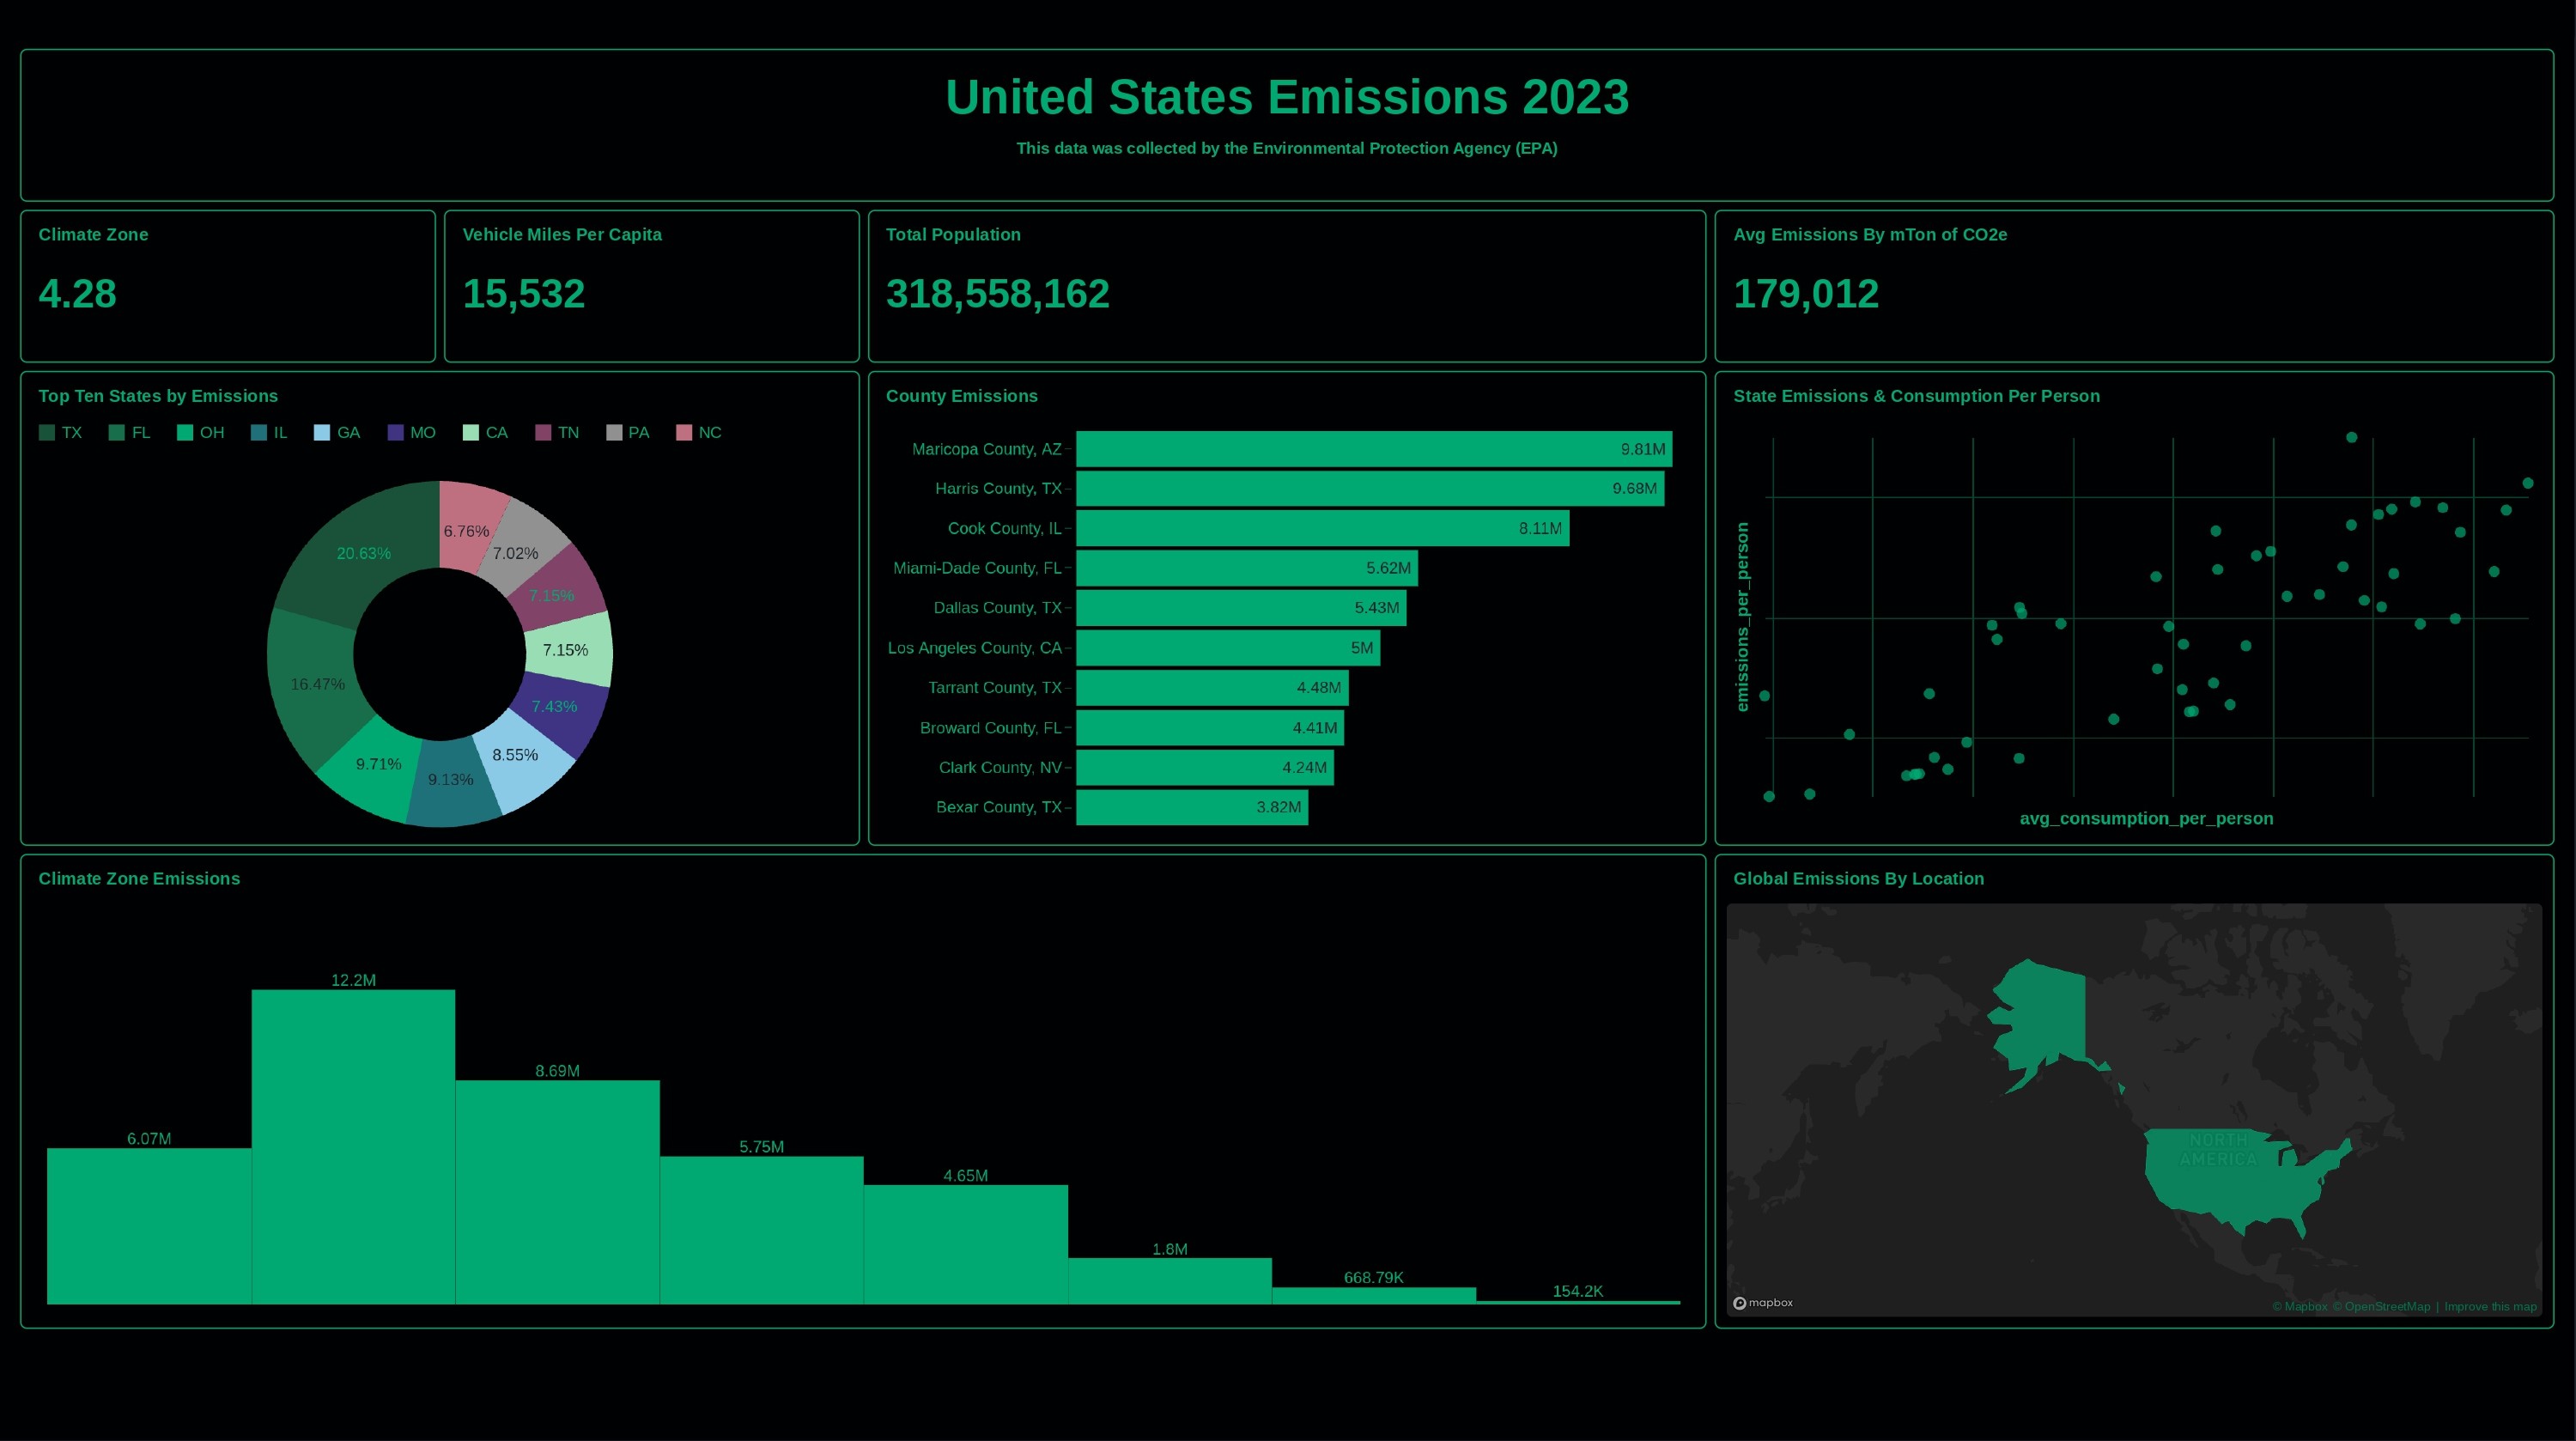
This project analyzes the EPA’s 2023 county‑level greenhouse‑gas emissions dataset using Databricks.
I cleaned and aggregated the data to summarise emissions by state and county, examined per‑capita and climate‑zone patterns, and delivered insights and recommendations for reducing emissions.
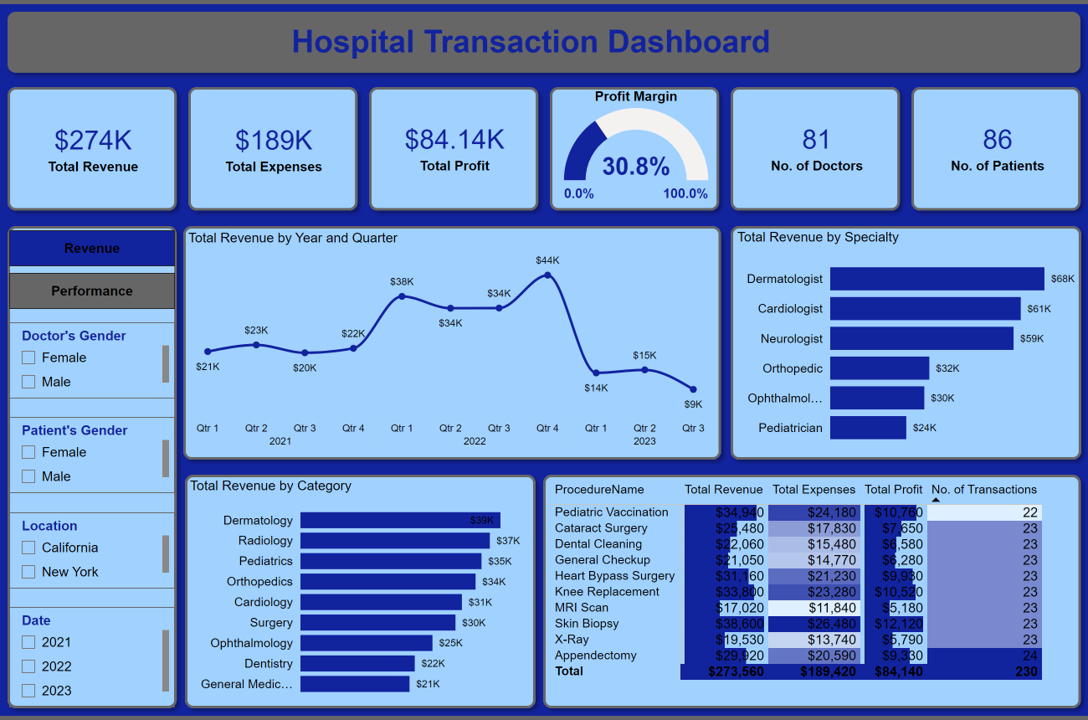
A concise, interactive analysis of hospital transaction data using Power BI.
The project cleans, models and visualizes revenue, expenses, profits and key metrics to reveal trends, top-performing specialties and actionable insights for data-driven decision making.
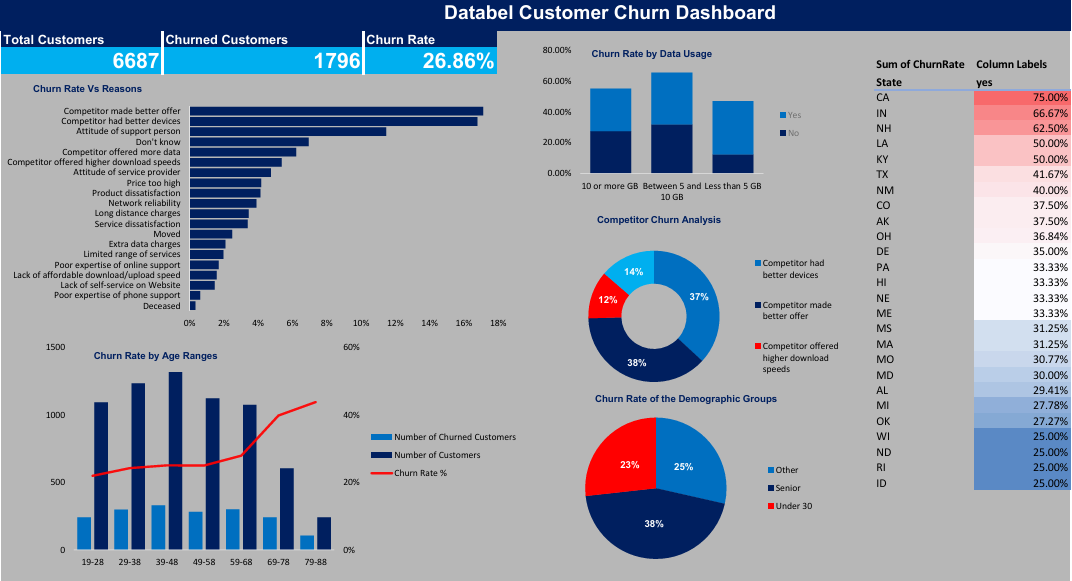
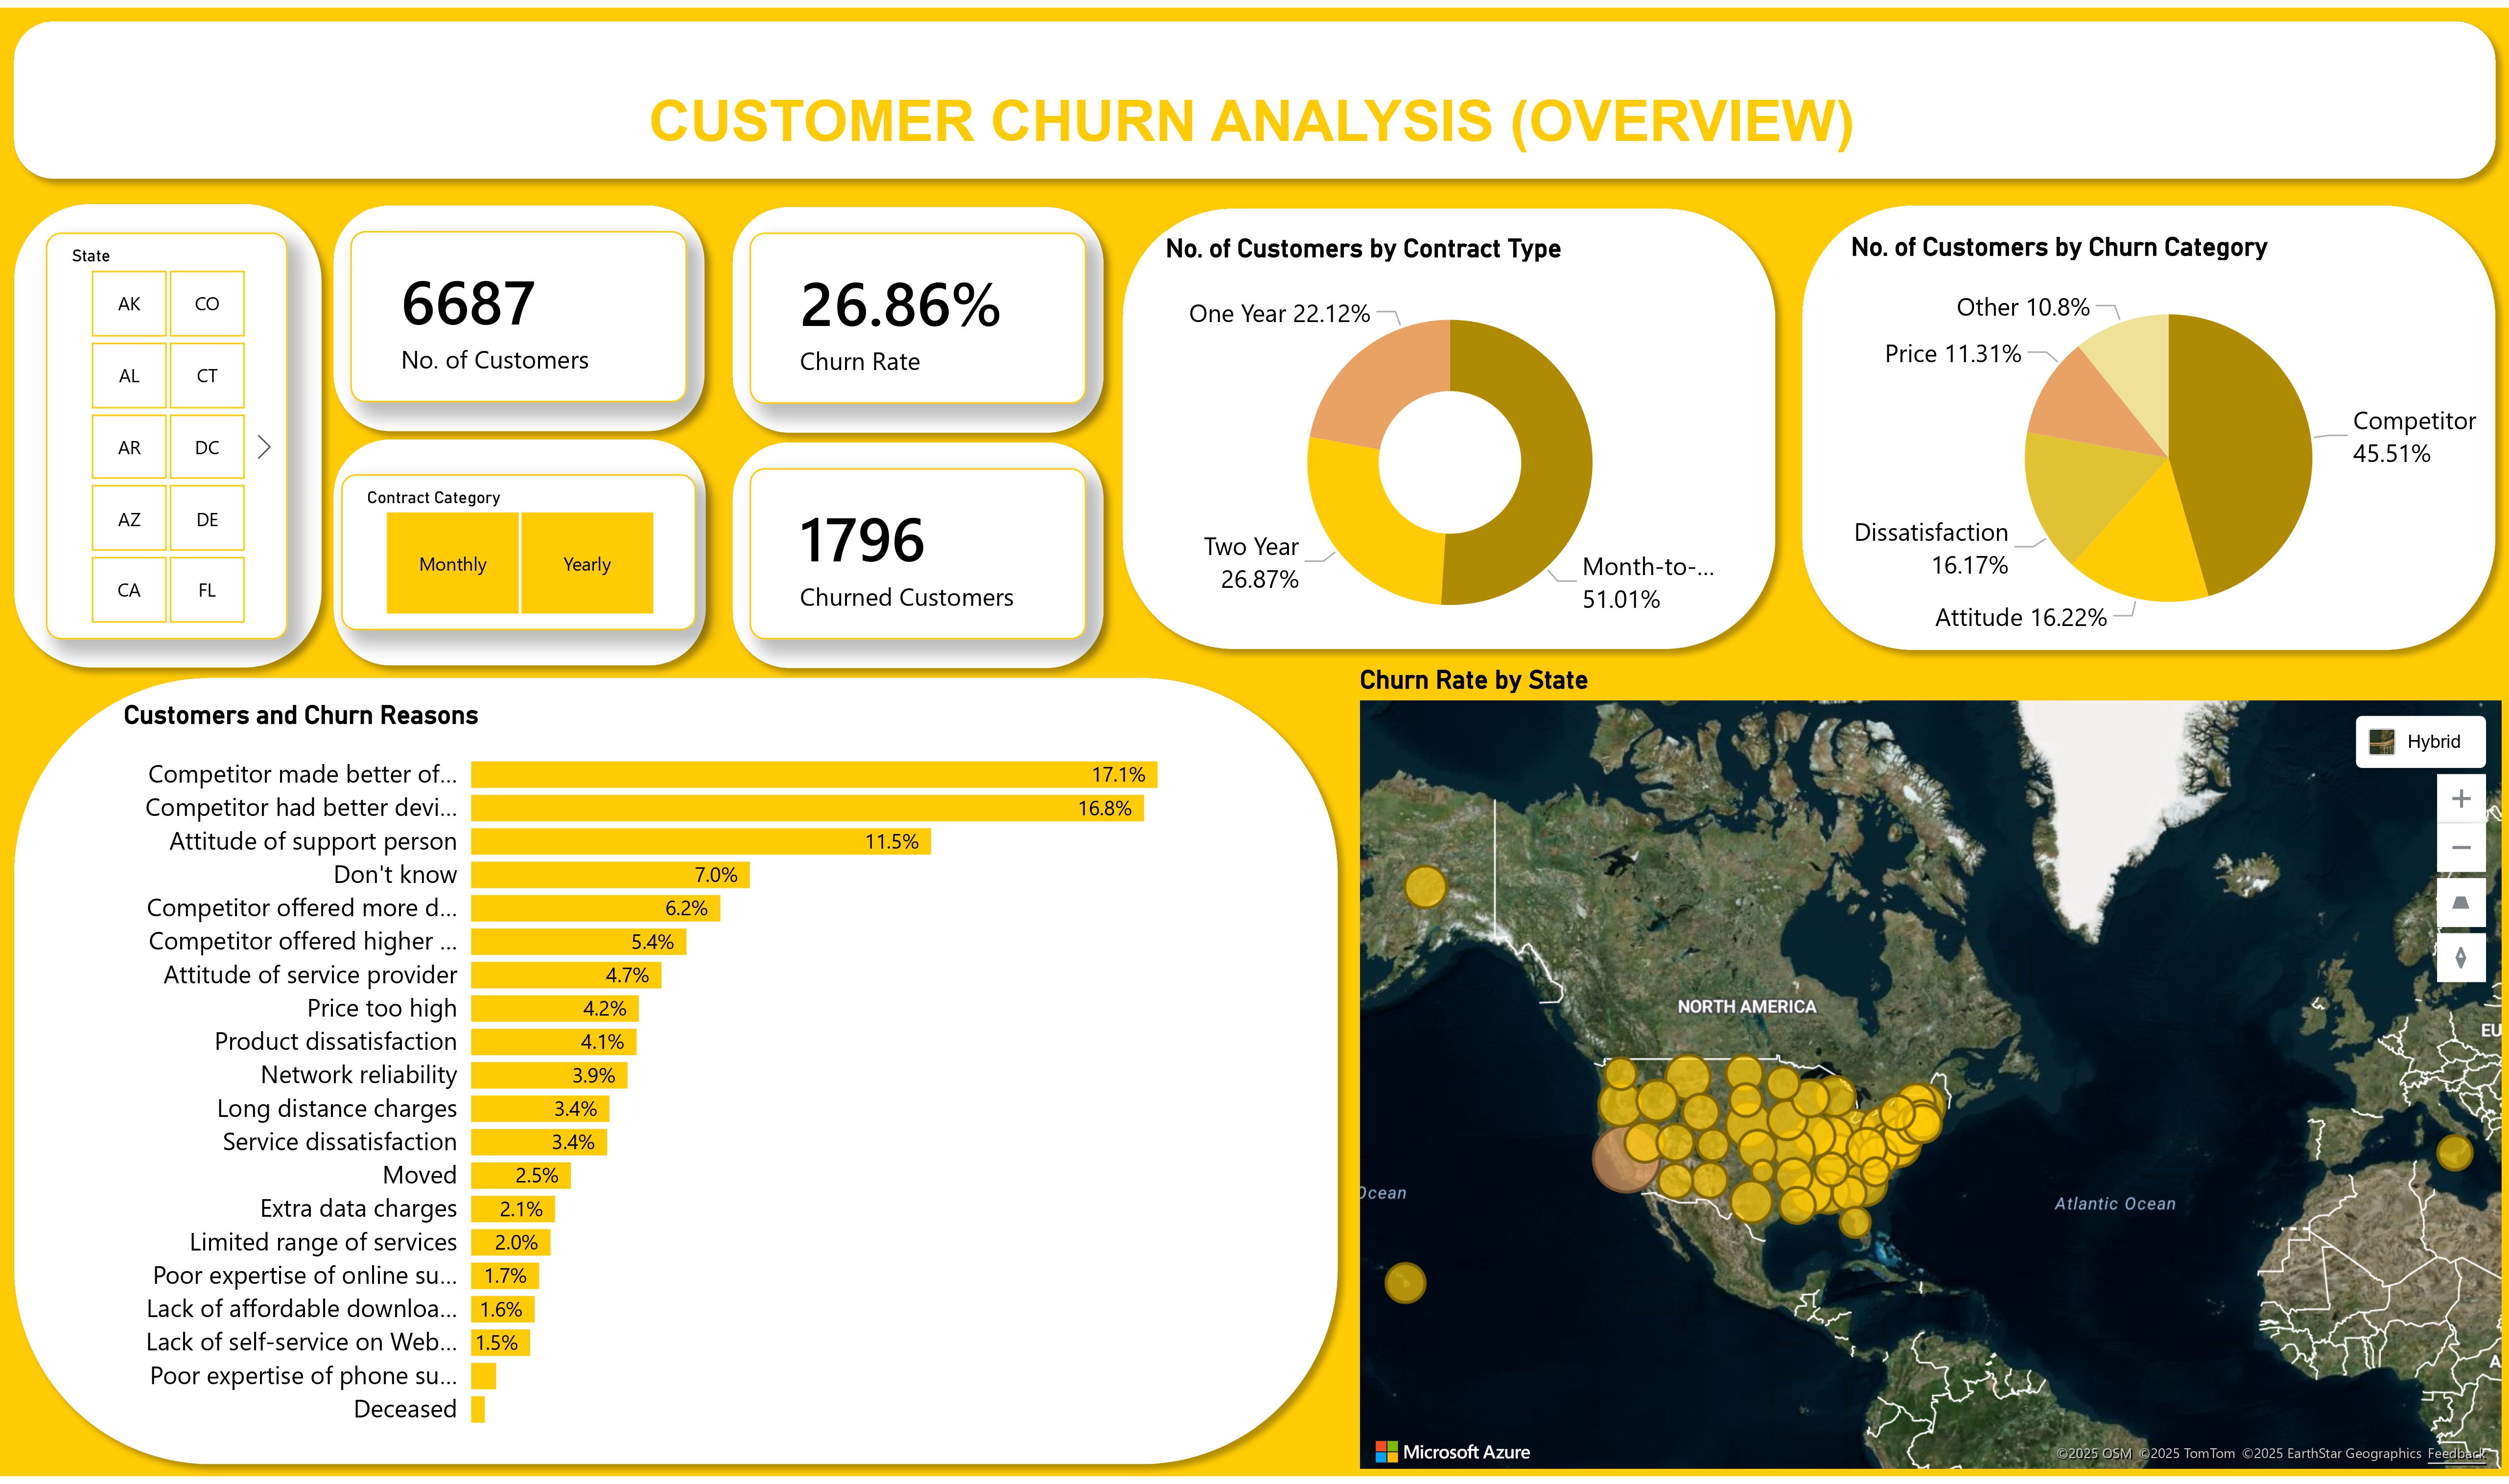
A comprehensive Excel-based churn analysis exploring customer behavior, churn drivers, demographic patterns, and competitor impacts.
Includes cleaned datasets, pivot tables, and a dashboard to support data-driven retention strategies.
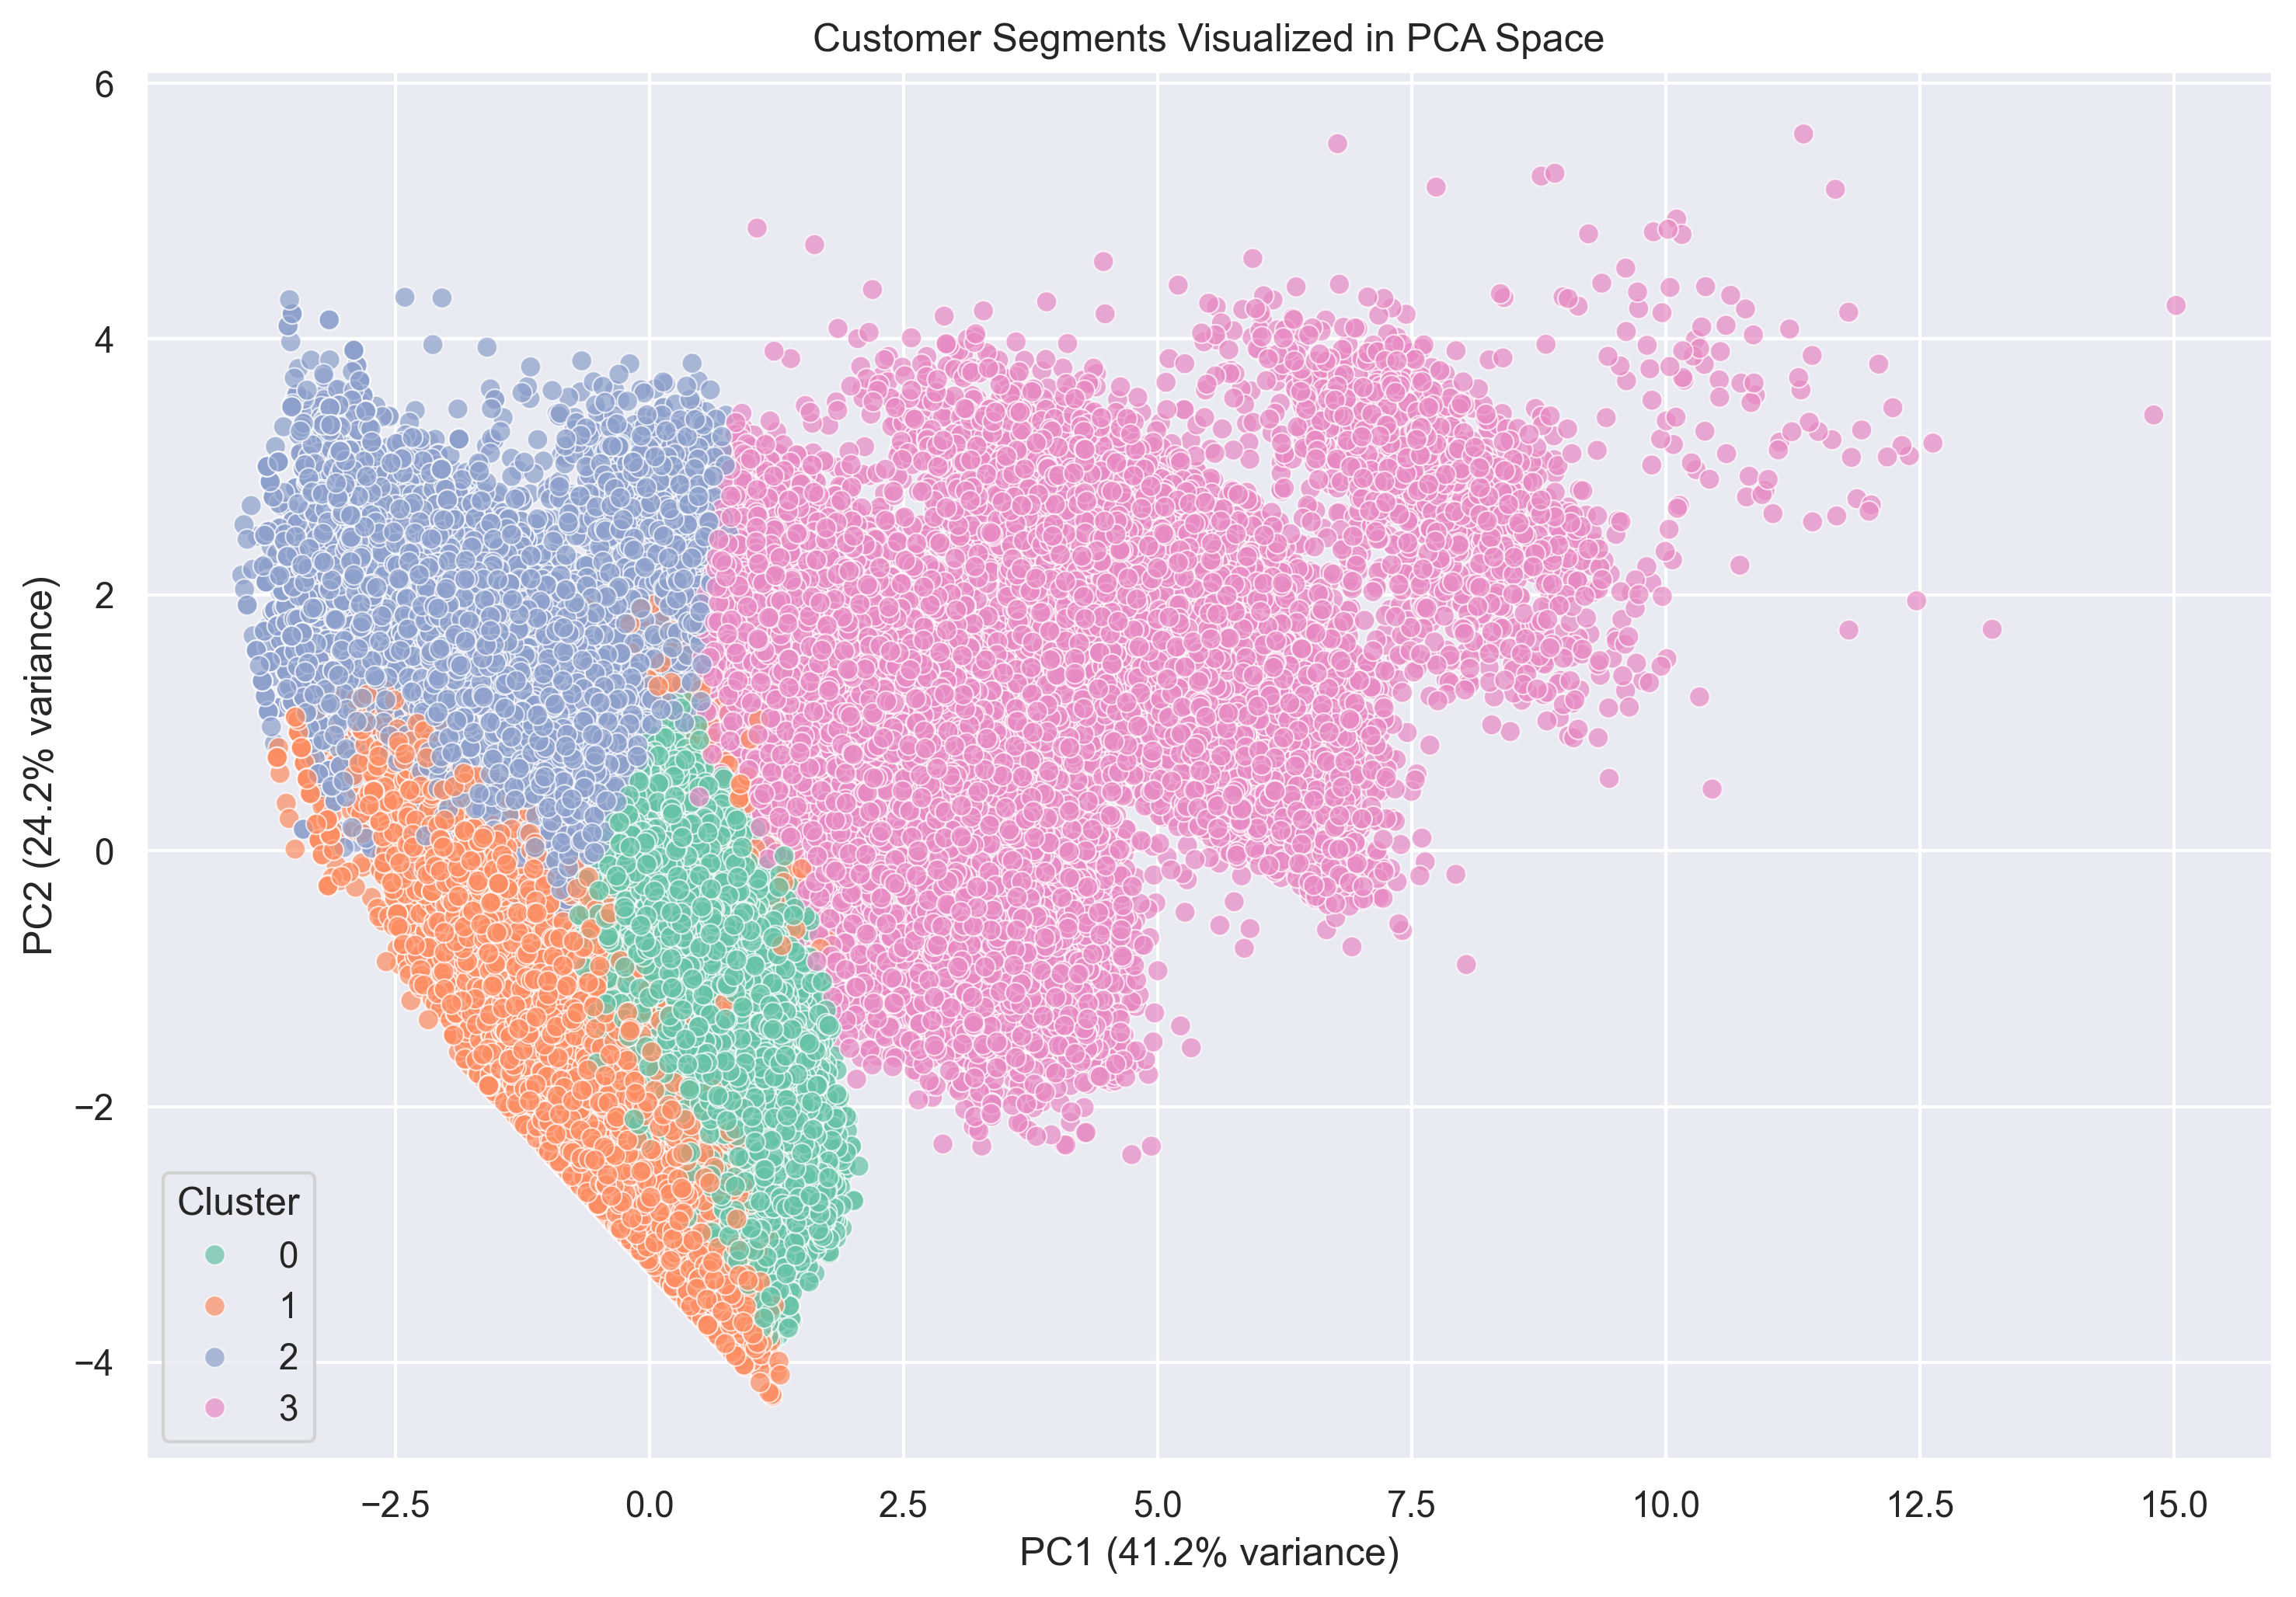
Unsupervised customer segmentation project to identify high-impact customer groups and support targeted banking strategies like loyalty programs, retention, and personalized offers.
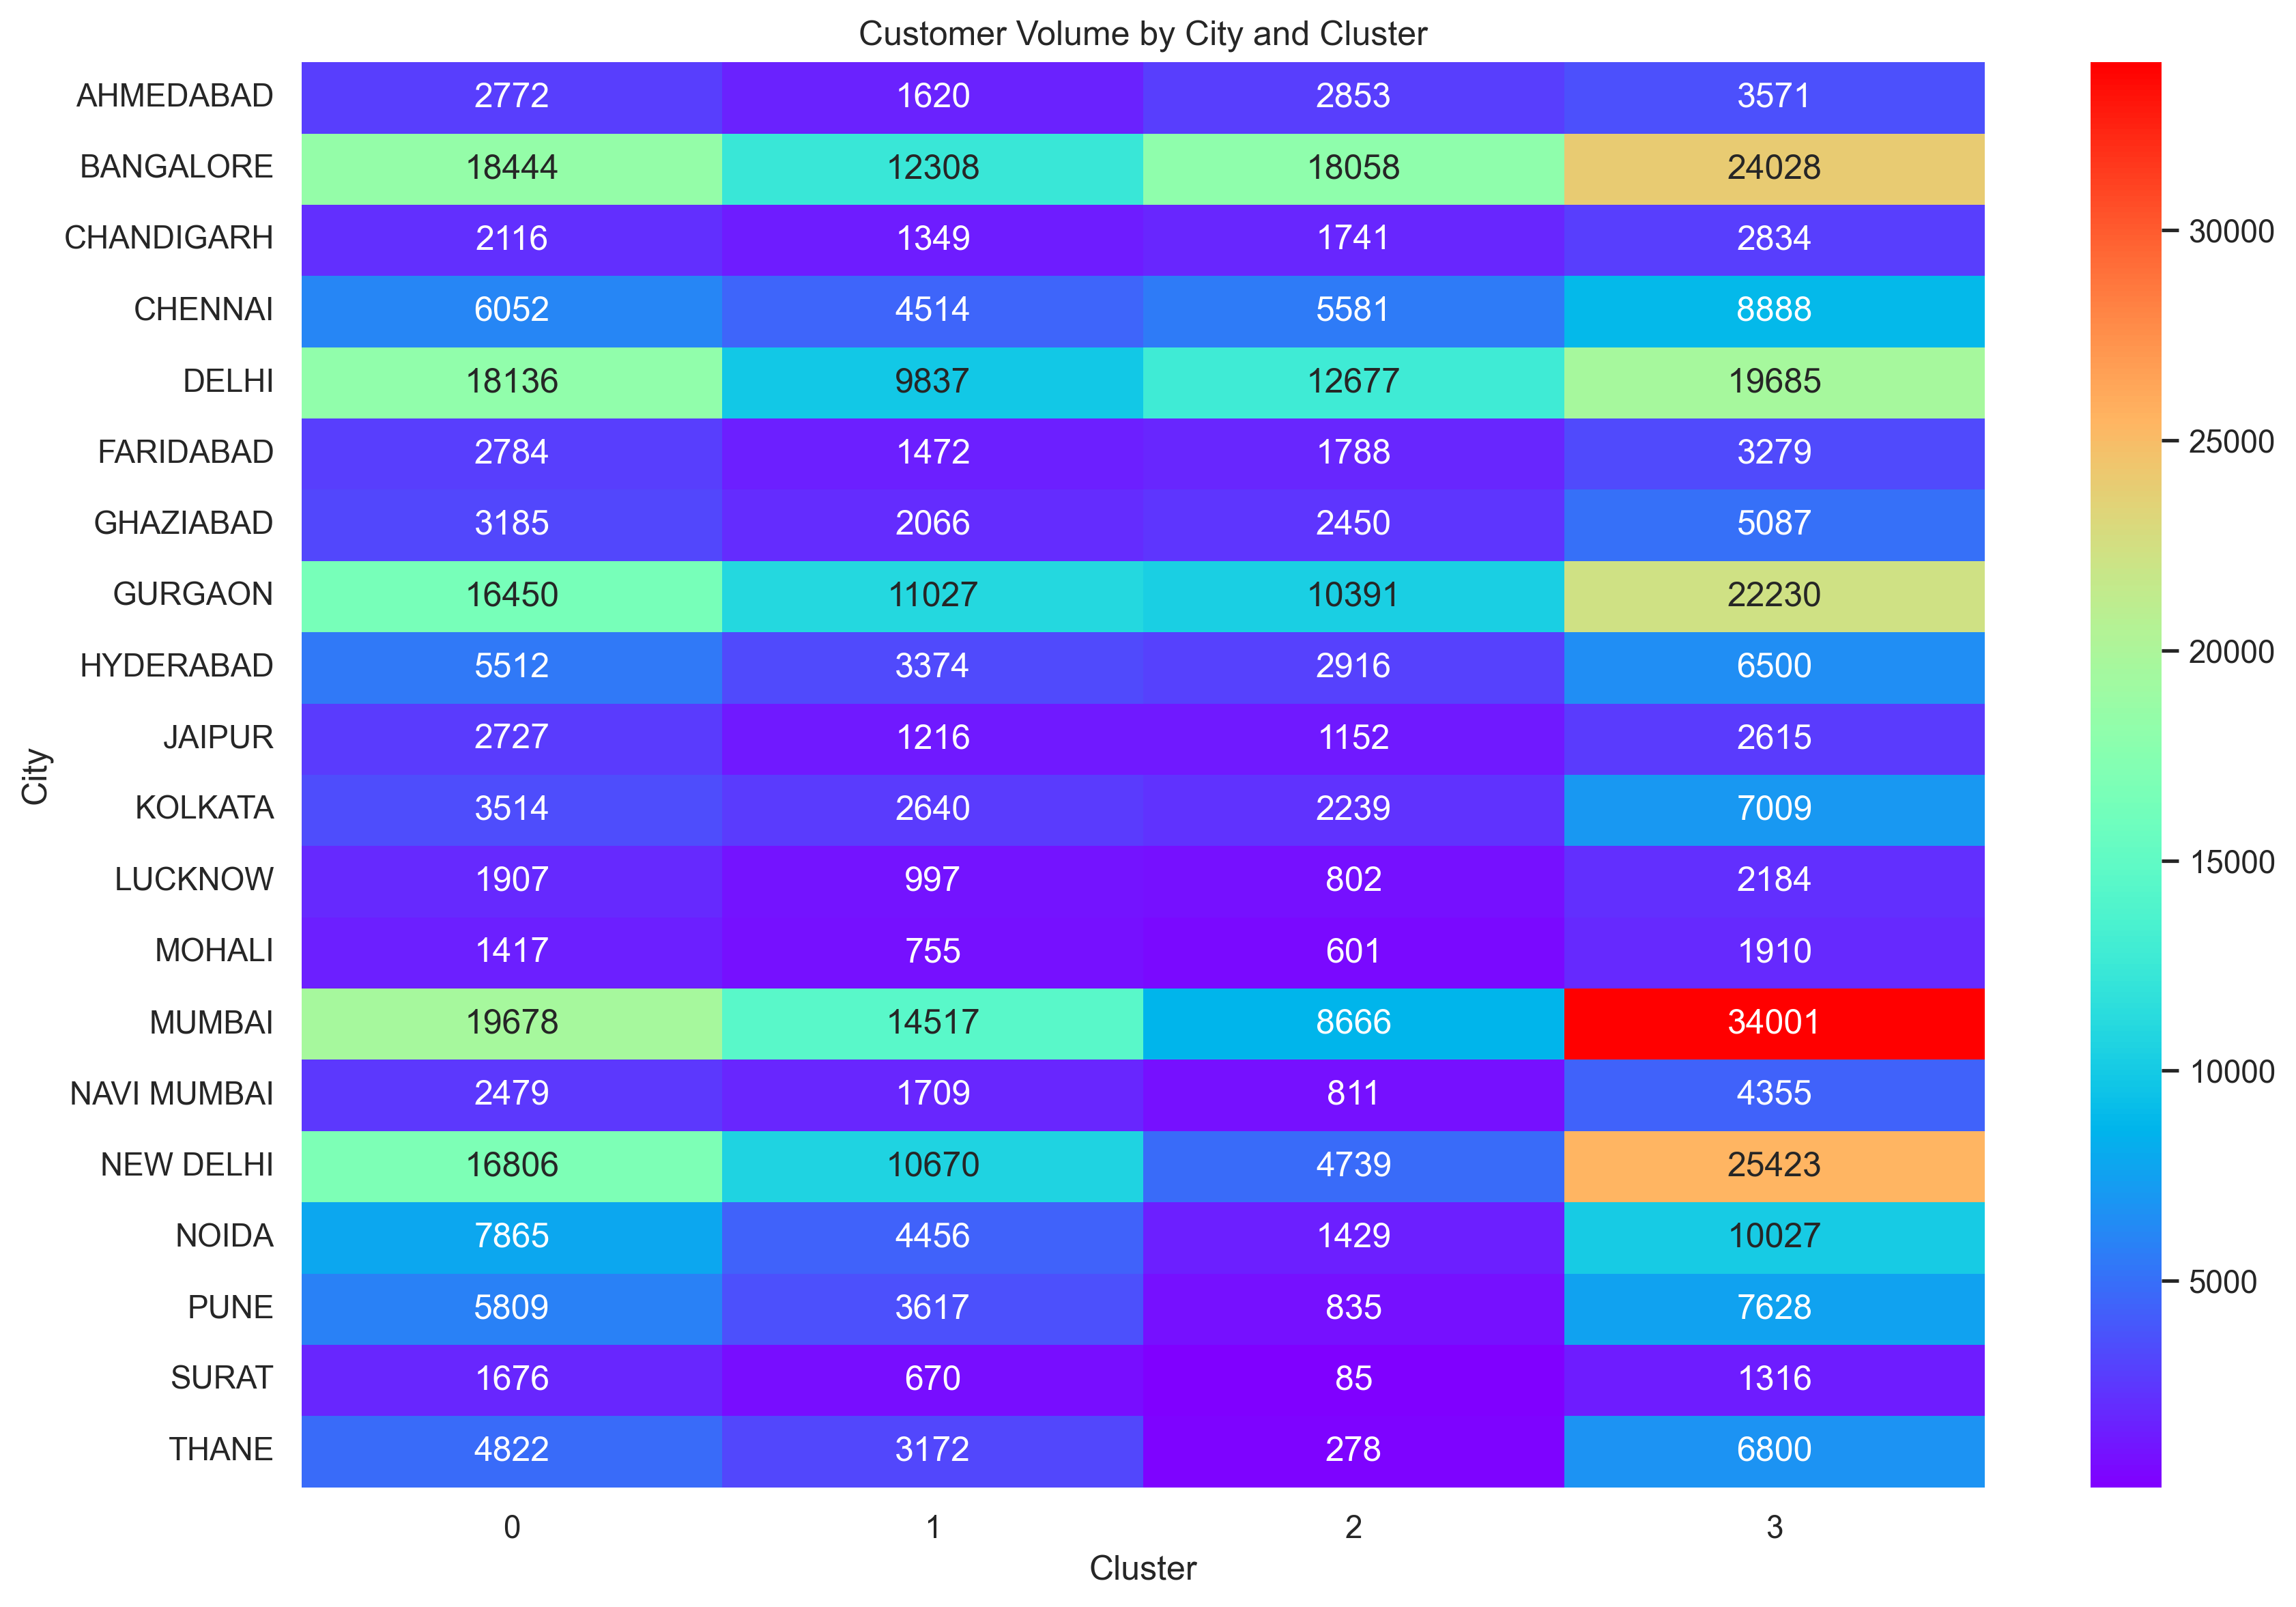
Location-specific insights to design tailored banking strategies that go beyond the one-size-fits-all.
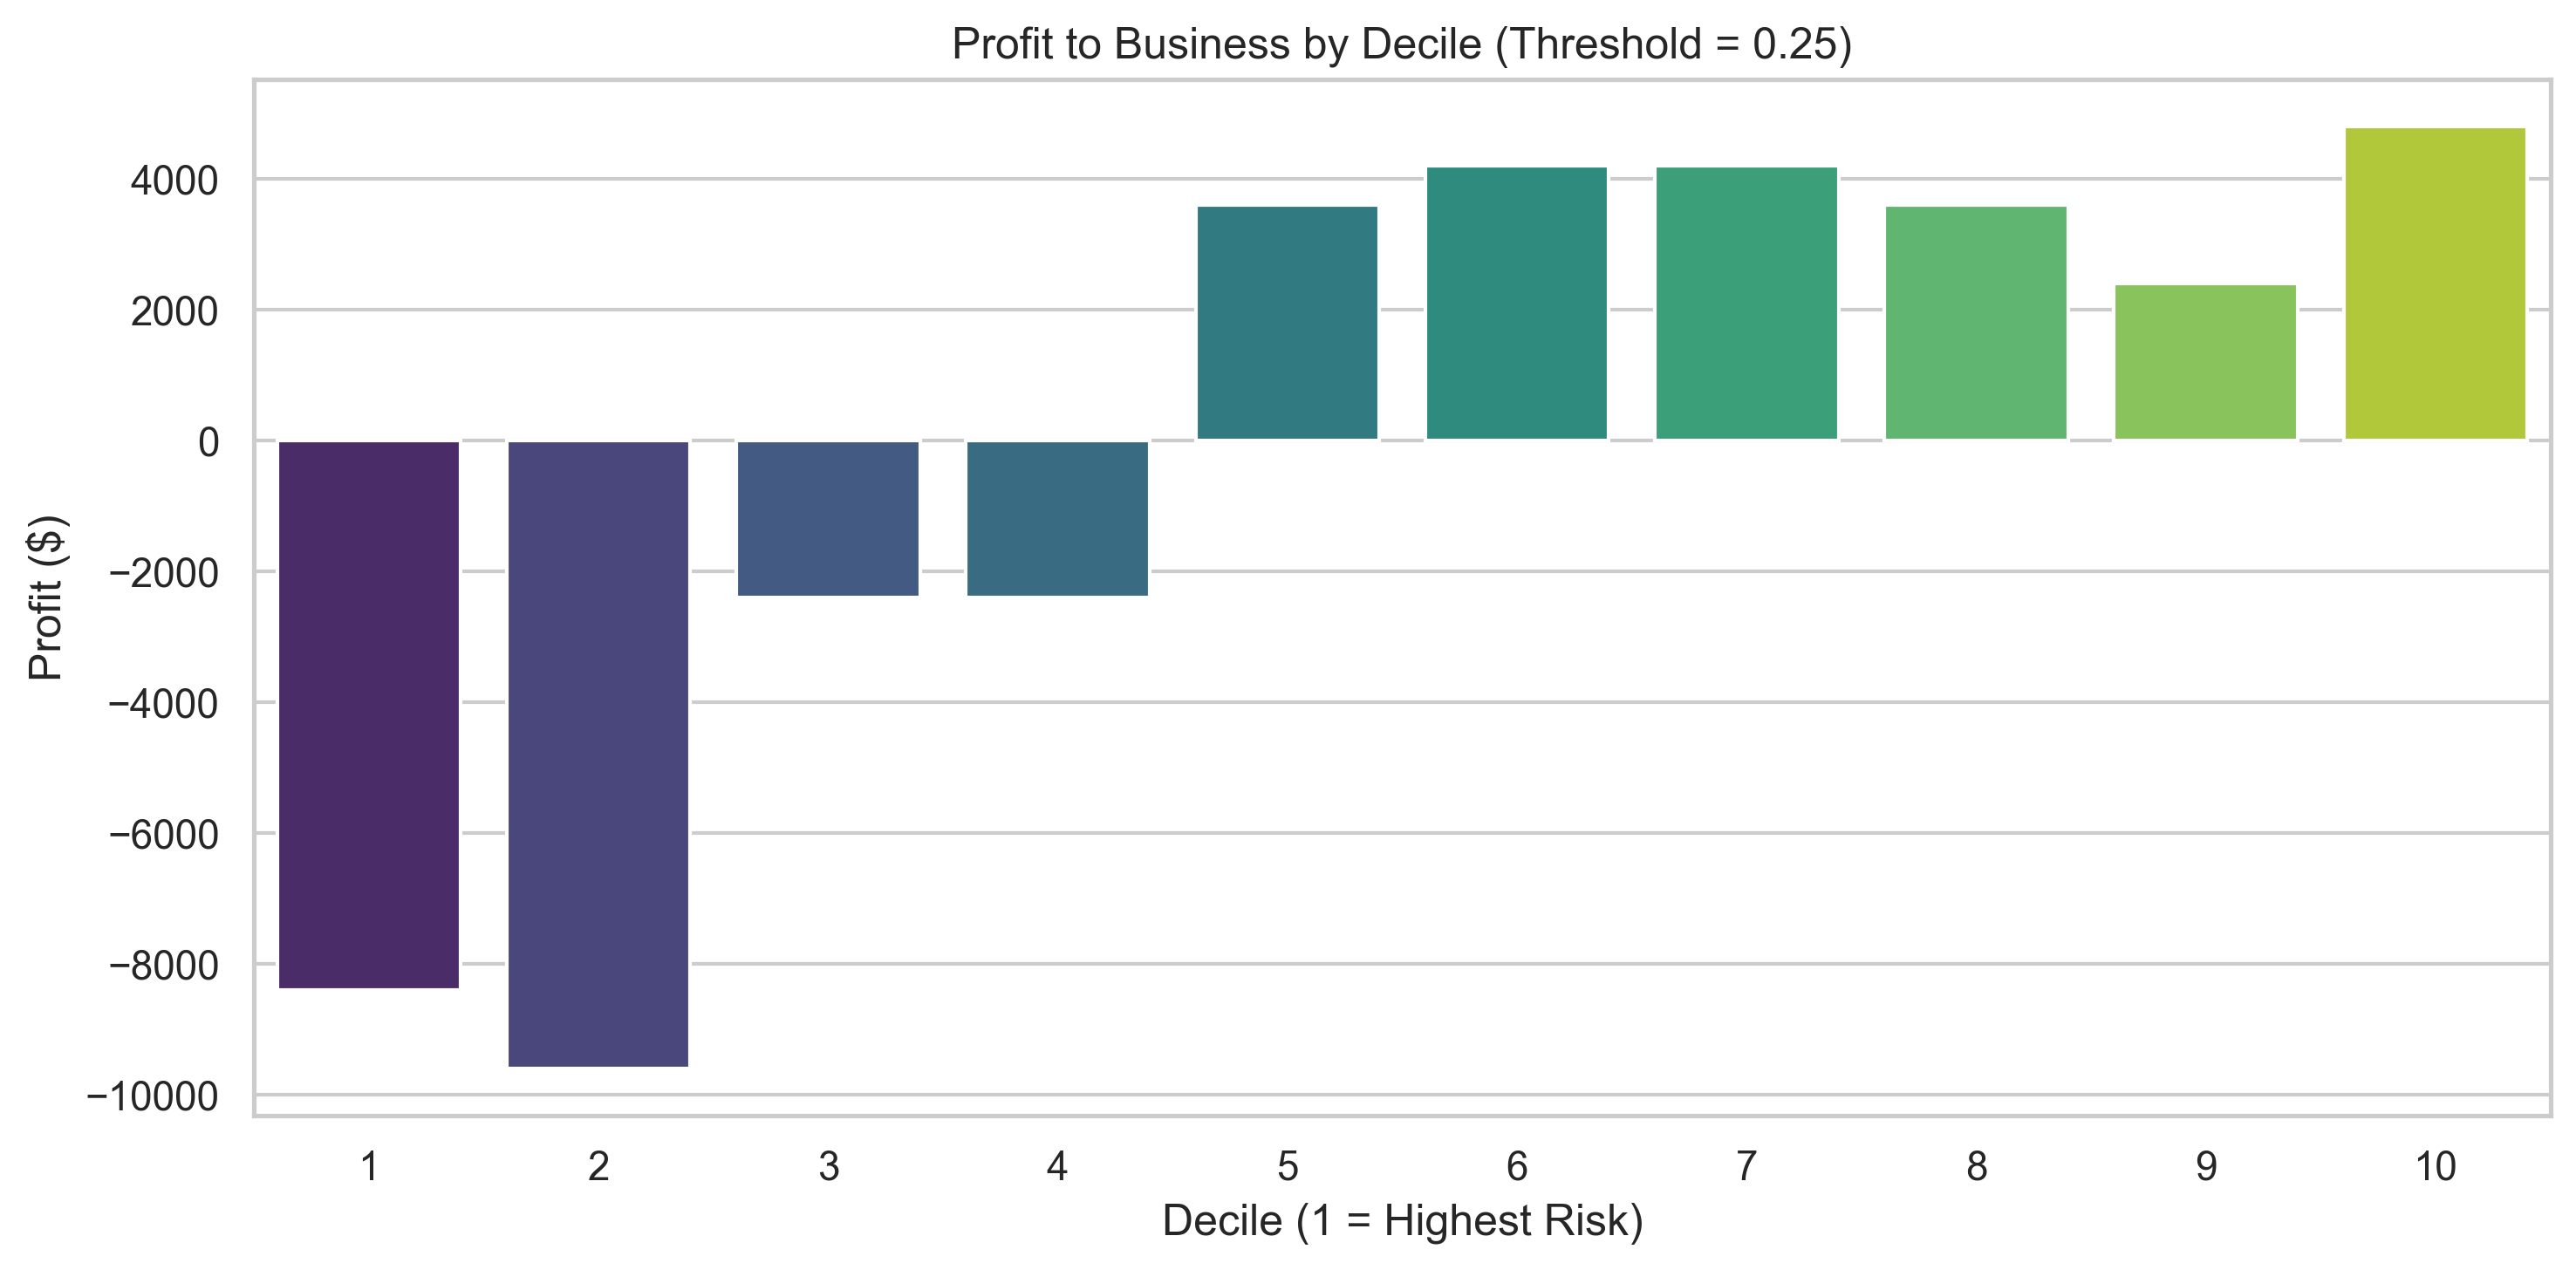
A credit scoring model to predict loan default risk using machine learning. It is designed to support smarter lending decisions and reduce losses from high-risk loan approvals.
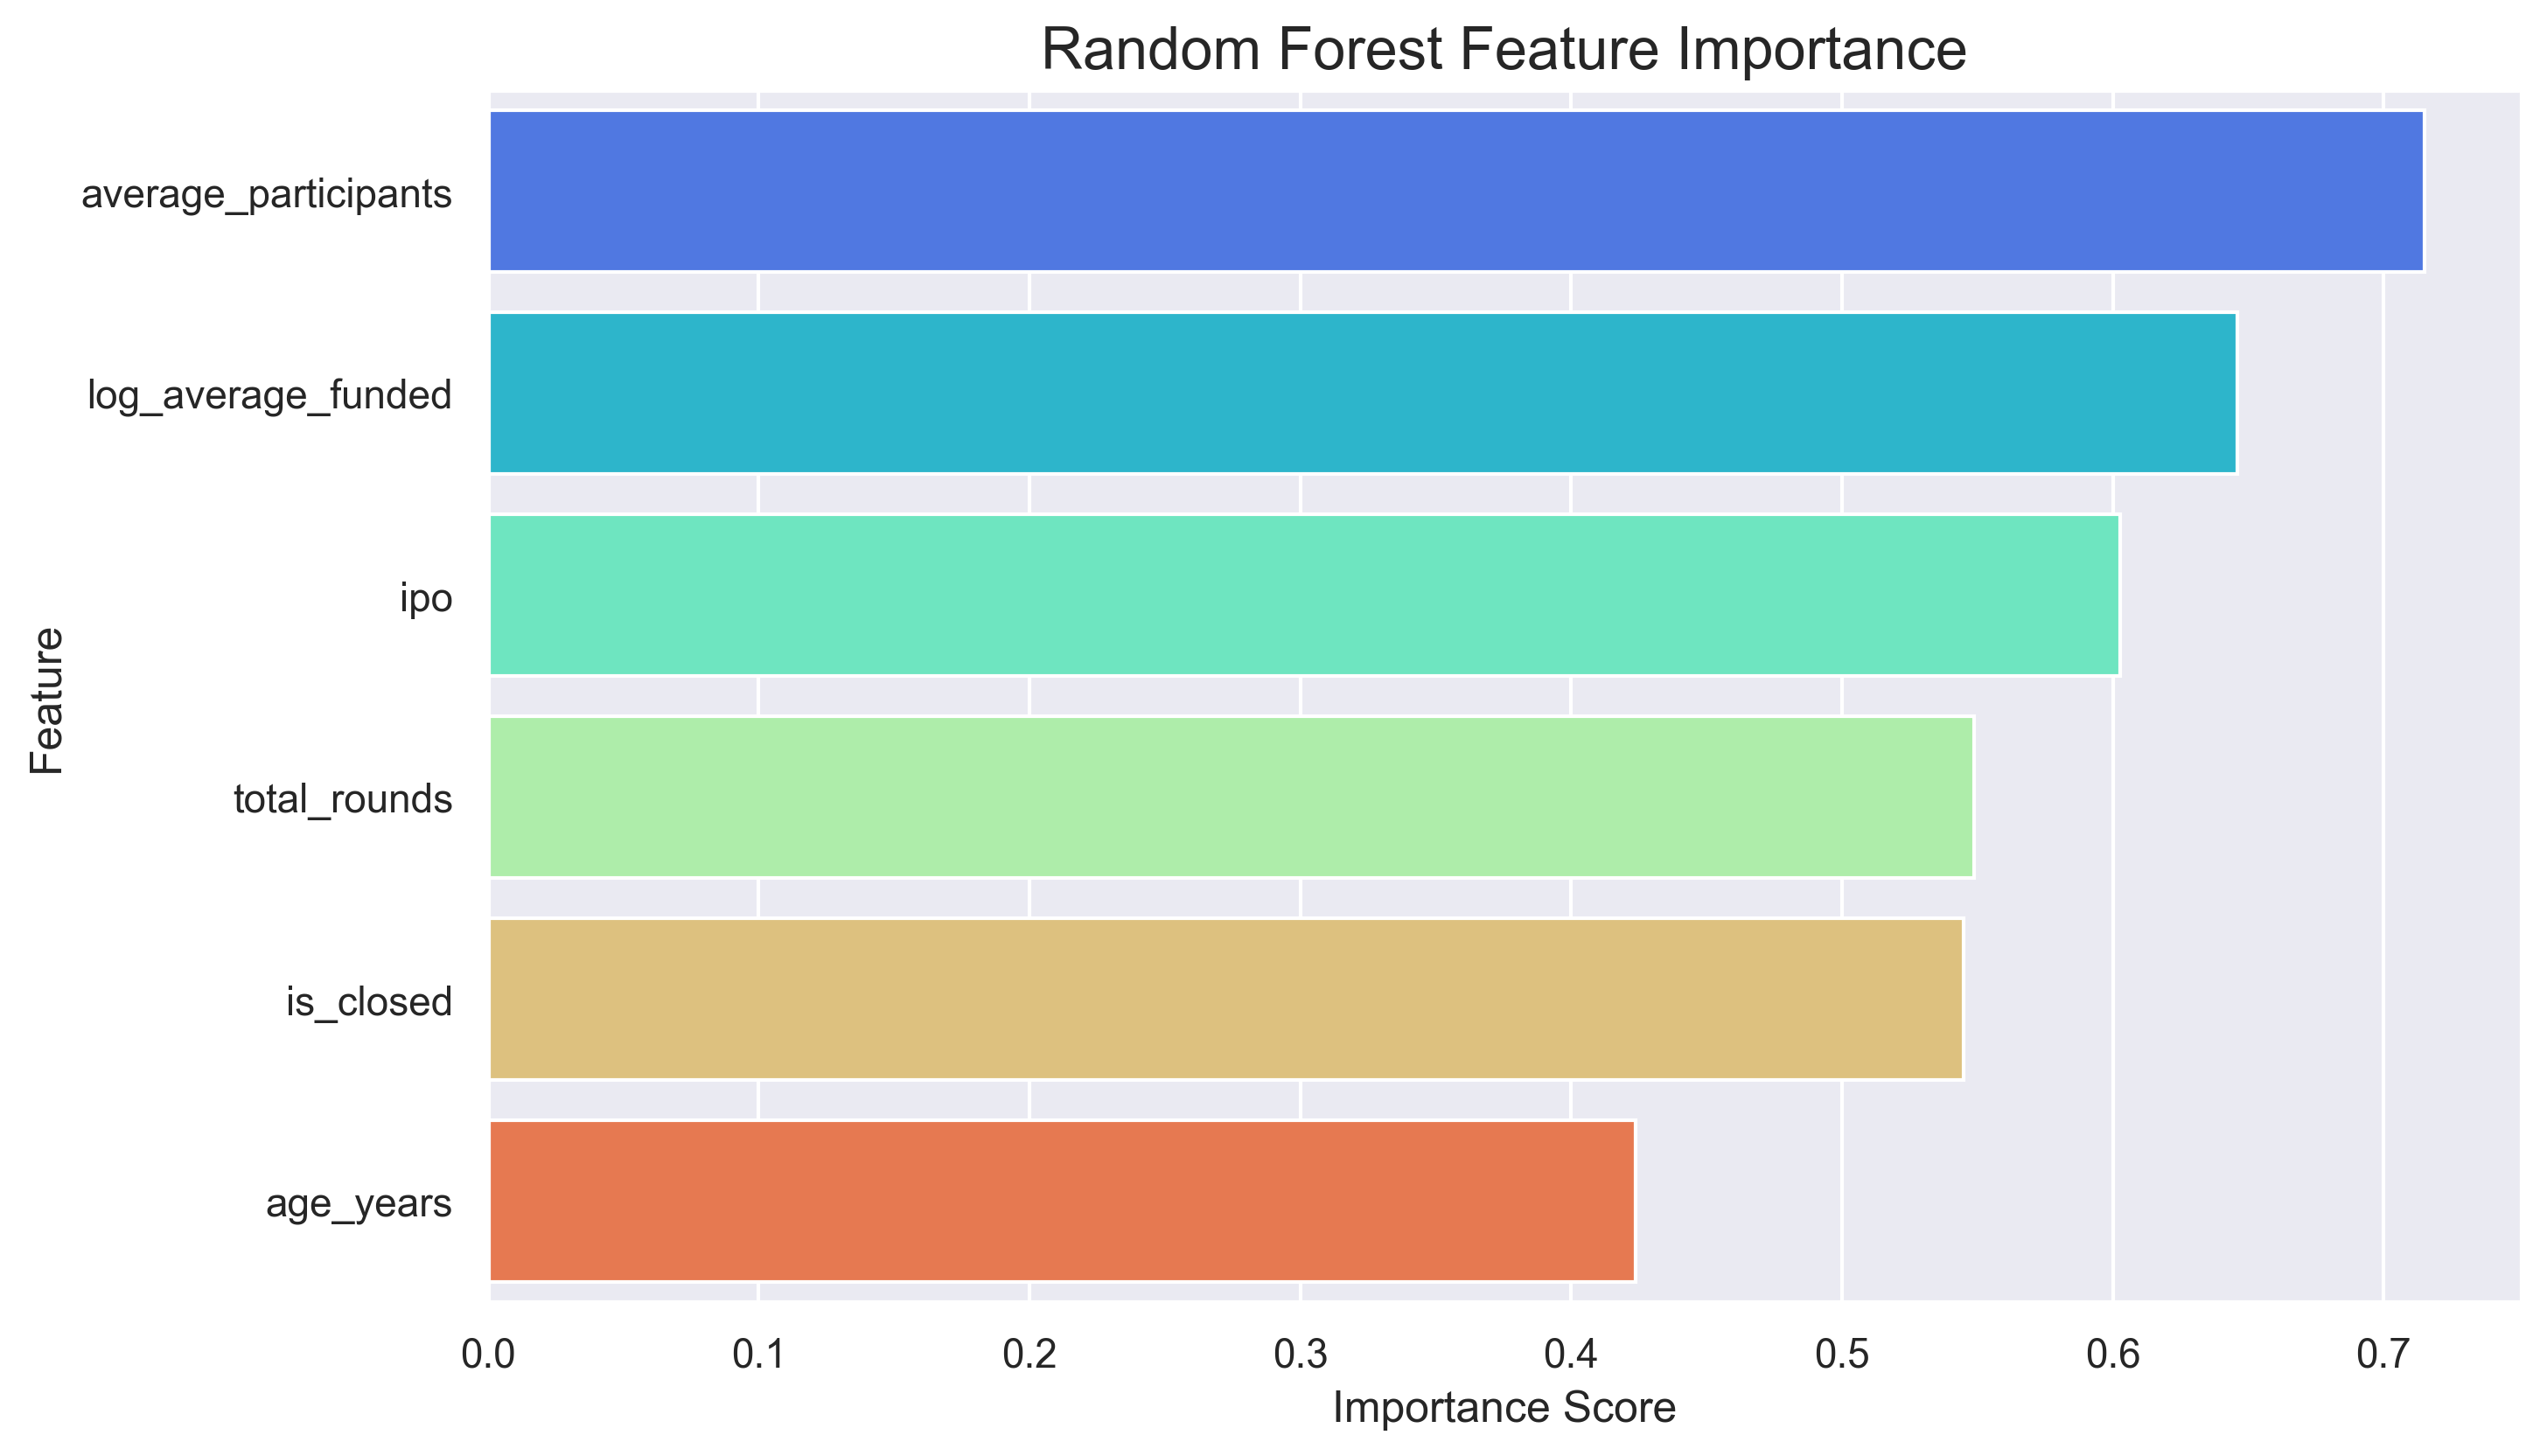
A model that predicts startup success from data on early-stage investments in the Crunchbase database.
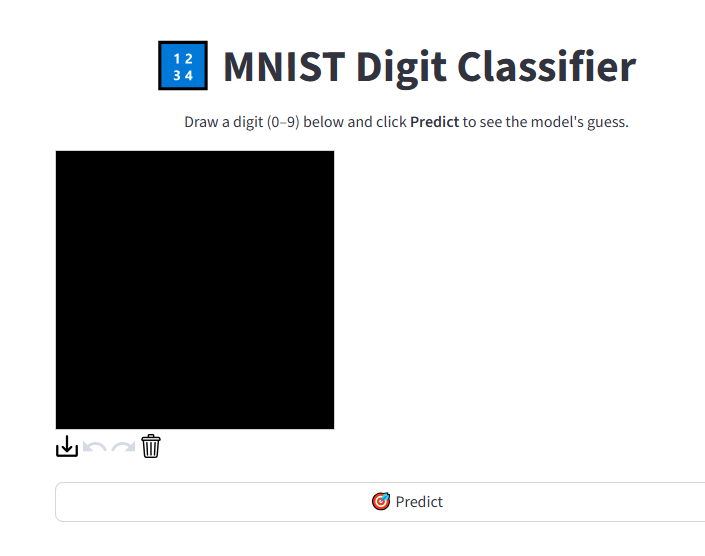
A simple Streamlit app that lets you draw digits (0–9) and predicts them using a deep learning model trained on the MNIST dataset.

Data exploration of Covid-19 dataset in SQL Server Management Studio.

This project is about cleaning the Nashville Housing Data using queries such as CONVERT, SUBSTRINGS, PARSENAME, CTE, and PARTITION BY.
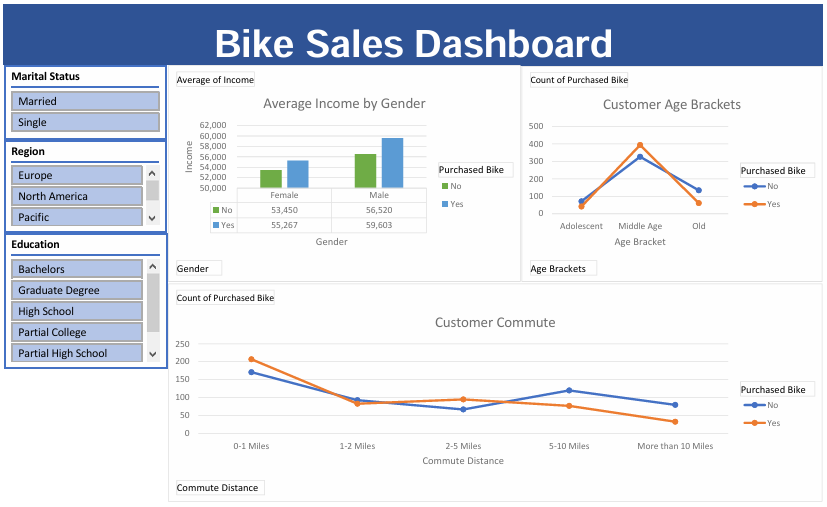
An analysis of bike sales data using Excel to identify trends in customer behavior, product performance, and revenue growth through data cleaning, visualization, and exploratory analysis techniques.